
TEA’s Four Pillars: Facts and Stats
March 9, 2021
Affordable Energy for our families
Affordable natural gas has saved an average family of four $2,500 a year. (“The Value of U.S. Energy Innovation and Policies Supporting the Shale Revolution,” The Council of Economic Advisers, 10/19)
American families have saved $147 billion over the last decade because of affordable natural gas. (“AGA Playbook,” American Gas Association, 2023)
Households that use natural gas for heating, cooking and other appliances save an average $1,068 per year compared to homes using electricity for such appliances. (“AGA Playbook,” American Gas Association, 2023)
American businesses have saved $500 billion over the last decade because of affordable natural gas. (“AGA Playbook,” American Gas Association, 2023)
A study concluded that “the drop in natural gas prices in the late 2000s, induced largely by the boom in shale gas production, averted 11,000 winter deaths per year” in the U.S.. (Janjala Chirakijja, Seema Jayachandran and Pinchuan Ong, “Inexpensive Heating Reduces Winter Mortality,” National Bureau Of Economic Research, 3/19)
Natural gas is 3.4 times more affordable than electricity as a residential energy source for the same amount of delivered energy. (“AGA Playbook,” American Gas Association, 2023)
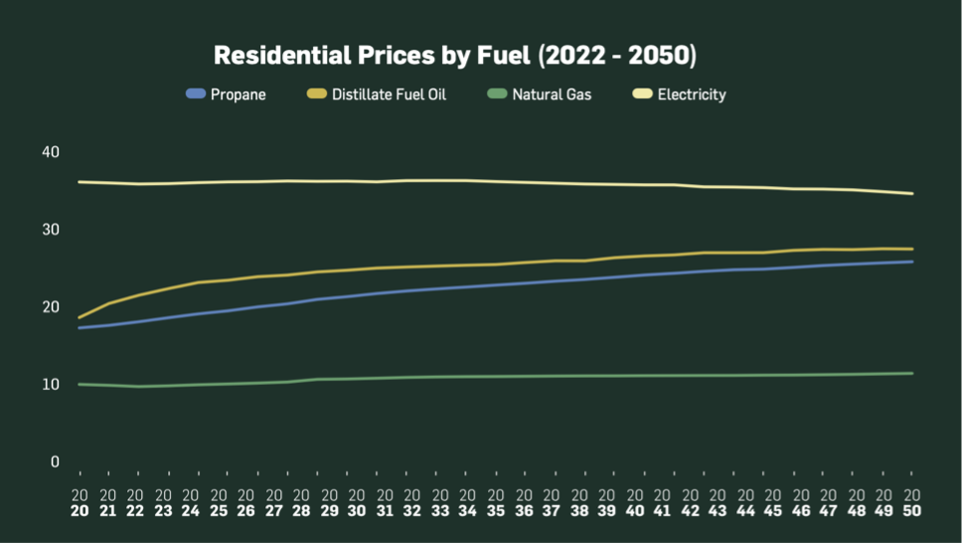
Natural gas will continue to cost less than electricity for the next 30 years. (“AGA Playbook,” American Gas Association, 2023)
The U.S. oil and natural gas industry contributed nearly $1.8 trillion to the U.S. economy in 2021. (“New Analysis: America’s Abundant Natural Gas and Oil Resources Deliver Americans Nearly $2 Trillion in Economic, Trade & Job Benefits,” American Petroleum Institute, Accessed 5/15/23)
From 2013 to 2018, natural gas development generated $101 billion in real GDP growth each year. (American Gas Association, et al, Letter to Members of the United States House of Representatives Committee on Energy & Commerce Subcommittee on Energy, 2/3/20)
This growth resulted in approximately 730,000 more jobs that contributed $87 billion more in annual disposable income. (American Gas Association, et al, Letter to Members of the United States House of Representatives Committee on Energy & Commerce Subcommittee on Energy, 2/3/20)
A full ban on hydraulic fracturing in the U.S. would eliminate 19 million jobs and reduce U.S. GDP by $7.1 trillion. (“What if hydraulic fracturing was banned?,” S. Chamber of Commerce Global Energy Institute, 12/19)
A “zero-emission” power grid would cost the U.S. $4.5 trillion. (Dan Shreve, “Deep decarbonisation: the multi-trillion-dollar question,” Wood Mackenzie, 6/27/19)
That cost would equate to $35,000 per U.S. household, or nearly $2,000 a year over the course of a 20-year plan. (Dan Shreve, “Deep decarbonisation: the multi-trillion-dollar question,” Wood Mackenzie, 6/27/19)
A zero-emissions transportation system could cost an average American household from $9,000 to $20,000 through 2029. (Douglas Holtz-Eakin, Dan Bosch, Ben Gitis, Dan Goldbeck, and Philip Rossetti, “The Green New Deal: Scope, Scale, And Implications,” American Action Forum, 2/25/19)
Clean Energy For Our Environment
Since 1970, combined emissions of key pollutants have dropped by 78% in the U.S. (“Our Nation’s Air: Trends Through 2022,” Environmental Protection Agency, 2023)
The U.S. is the world leader in lowering carbon emissions, largely because of increased use of natural gas for electricity generation. (Mark Perry, “Some Charts and Commentary Based on BP’s Annual Report on World Energy Statistics,” American Enterprise Institute, 7/9/21)
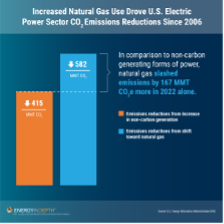
Increased use of natural gas for electricity generation is the top reason for U.S. power sector emissions reductions over the past 17 years—almost double the impact compared to renewable power generation. (Mandi Risko, “Natural Gas Is, Once Again, Spearheading Emission Reductions Across The U.S. Power Sector,” Energy In Depth, 11/30/23)
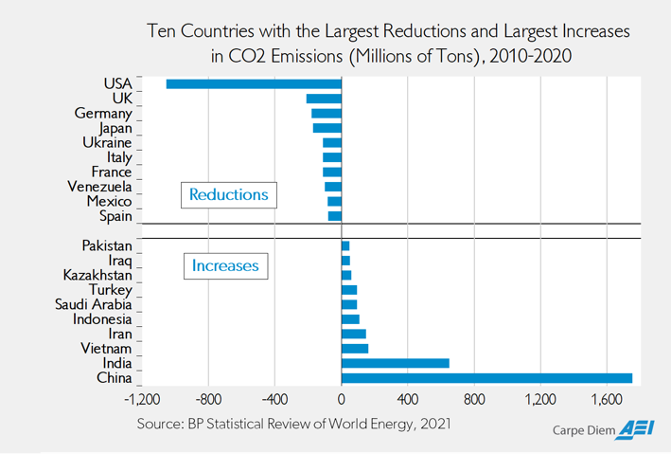 (Mark Perry, “Some Charts and Commentary Based on BP’s Annual Report on World Energy Statistics,” American Enterprise Institute, 7/9/21)
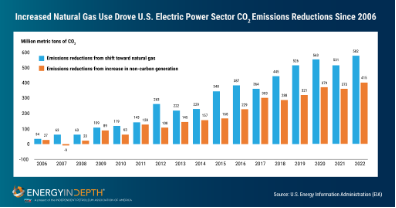
(Mandi Risko, “Natural Gas Is, Once Again, Spearheading Emission Reductions Across The U.S. Power Sector,” Energy In Depth, 11/30/23)
In 2022 alone, the shift to natural gas provided an emissions reduction equivalent to 156 coal-fired power plants operating for a year. (Mandi Risko, “Natural Gas Is, Once Again, Spearheading Emission Reductions Across The U.S. Power Sector,” Energy In Depth, 11/30/23)
Since 2005, natural gas used for power generation has cut nearly double the emissions that renewable sources like wind and solar have. (Mandi Risko, “Natural Gas Is, Once Again, Spearheading Emission Reductions Across The U.S. Power Sector,” Energy In Depth, 11/30/23)
Natural gas is responsible for 58 percent of U.S. electricity generation CO2 reductions. (Max Sternberg, “New Eia Report Shows Emissions Falling In The Power Generation Sector Thanks To Natural Gas,” Energy In Depth, 12/16/22)
Switching to natural gas from coal for electricity generation reduces greenhouse gas emissions by an average of 54%. (“AGA Playbook,” American Gas Association, 2023)
The surge of natural gas for power generation helped the sector reach a 30-year low for carbon dioxide emissions. (Seth Whitehead, “Report: Power Sector Co2 Emissions At Lowest Levels Since 1988 — Thanks Largely To Natural Gas,” Energy In Depth, 4/4/18; “AGA Playbook,” American Gas Association, 2023)
Since 1990, emissions from the natural gas distribution system have declined 69%. (“AGA Playbook,” American Gas Association, 2023)
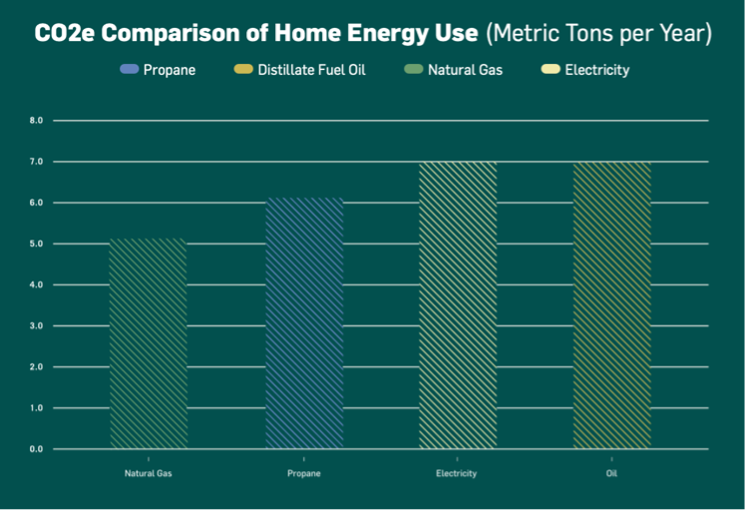
CO2 emissions from homes that use natural gas for heating and appliances are about 22% lower than those from an all-electric home. (“AGA Playbook,” American Gas Association, 2023)
(Mandi Risko, “Natural Gas Is, Once Again, Spearheading Emission Reductions Across The U.S. Power Sector,” Energy In Depth, 11/30/23)
 (“AGA Playbook,” American Gas Association, 2023)
American Energy For Our Security
The U.S. has been the world’s top producer of natural gas since 2011, when it overtook Russia, and it has been a net exporter since 2017. (Lindsay Maizland and Anshu Siripurapu, “How the U.S. Oil and Gas Industry Works,” Council on Foreign Relations, 8/11/22)
In 2018, the U.S. surpassed Russia and Saudi Arabia to become the world’s top producer of natural gas AND oil largely because of the U.S. shale revolution. (“The U.S. Leads Global Petroleum And Natural Gas Production With Record Growth In 2018,” S. Energy Information Administration, 8/20/19; “What countries are the top producers and consumers of oil?,” U.S. Energy Information Administration, Updated 12/8/21)
In December 2020, for the first time in 35 years, the U.S. imported no weekly crude oil from Saudi Arabia. (Sheela Tobben and Julian Lee, “U.S. Imports No Saudi Crude for First Time in 35 Years,” Bloomberg, 1/6/21)
From 2008 to 2018, the U.S. energy trade deficit was reduced by 87%, or $363 billion. (Nikos Tsafos, “Can Energy Close America’s Trade Deficit?,” Center For Strategic & International Studies, 7/10/18)
In 2022, the U.S. became the largest exporter of LNG by volume in the world. (“The United States became the world’s largest LNG exporter in the first half of 2022,” S. Energy Information Administration, 7/25/22;
As of 2022, we have shipped U.S. LNG to over 35 countries around the globe — and counting. (“Exports,” Center for Liquefied Natural Gas, Accessed 3/14/22)
According to the Center for Liquid Natural Gas, “Secure, reliable U.S. liquefied natural gas (LNG) is playing a critical role in stabilizing global energy markets, especially those in Europe.” (“U.S. LNG Exports: Regulatory Certainty in Time of Crisis,” Center for Liquefied Natural Gas, Accessed 3/14/22)
Abundant Energy For Our Future
About 40% of U.S. electricity generation comes from natural gas. (“What is U.S. electricity generation by energy source?,” S. Energy Information Administration, Updated 10/20/23)
The U.S. has enough natural gas to power the nation for more than a century—and the potential for even more. (“AGA Playbook,” American Gas Association, 2023)
There are 2.6 million miles of pipeline in the U.S. to ensure natural gas gets to the consumers that need it. (“AGA Playbook,” American Gas Association, 2023)
From 2004 to 2019, natural gas reserves in the U.S. increased more than 148 percent. (“U.S. LNG Exports: Delivering Certainty in Time of Crisis,” Center for Liquefied Natural Gas, Accessed 3/14/22)
The U.S. oil and natural gas industry supports 10.8 million American jobs. (“New Analysis: America’s Abundant Natural Gas and Oil Resources Deliver Americans Nearly $2 Trillion in Economic, Trade & Job Benefits,” American Petroleum Institute, Accessed 5/15/23)
The natural gas industry alone supports more than 4.1 million American jobs. (“AGA Playbook,” American Gas Association, 2023)
Over the last decade, the surge in production from the shale revolution helped create 1.4 million new manufacturing jobs for Americans. (“U.S. Energy: The Key to the Reviving of U.S. Manufacturing,” ShaleCrescent USA, 10/20; Federal Reserve Bank of St. Louis, Updated 12/8/20)
Over 30,000 American businesses sign up to use natural gas each year. (“AGA Playbook,” American Gas Association, 2023)
Besides being an energy source, natural gas provides the base ingredient for everyday products like plastic, chemicals, fertilizer, anti-freeze, fabrics and much more. (“Uses In Industry,” org, 9/20/13; “Natural gas explained,” U.S. Energy Information Administration, Updated 4/28/23)
The U.S. farming sector and its suppliers are one of the largest natural gas consumers. The sector makes up almost 15% of U.S. commercial and industrial consumption. (“AGA Playbook,” American Gas Association, 2023)
The U.S. farming sector and its suppliers consume as much natural gas each year as the states of Pennsylvania and Utah combined. (“AGA Playbook,” American Gas Association, 2023)
Natural gas is integral to the health care industry both as a heating source and a key ingredient in many health products. ( “Energy Characteristics and Energy Consumed in Large Hospital Buildings in the United States in 2007,” S. Energy Information Administration, Released 8/17/12)
Natural gas powers more than 175,000 vehicles in the United States and roughly 23 million vehicles worldwide. (“Natural Gas Vehicles,” S Department Of Energy Alternative Fuels Data Center, Accessed 9/13/22)
Only 1 in 112 customers are expected to experience a natural gas outage in any given year. Electric distribution systems have an average of one outage per year per customer. (William Liss and Patricia Rowley, “Assessment of Natural Gas and Electric Distribution Service Reliability,” Gas Technology Institute, 7/19/19; “AGA Playbook,” American Gas Association, 2023)
About 14% of U.S. electricity generation comes from wind and solar energy. (“What is U.S. electricity generation by energy source?,” S. Energy Information Administration, Updated 10/20/23)
The natural gas delivery system is 92% efficient from production to customer. (“AGA Playbook,” American Gas Association, 2023)