
Tea Factsheet: Natural Gas is Green
March 19, 2024
Key Points
CO2 And Other Key Air Pollutants Have Consistently Declined In The U.S. At The Same Time The Use Of Natural Gas Has Increased And The Economy Has Grown
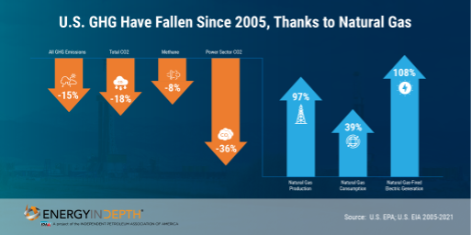
- As natural gas increases, pollution goes down: Since 2005, U.S. emissions have decreased across the board even as natural gas production has increased nearly 100 percent.
- Fewer emissions than other fuels: Natural gas emits far less carbon dioxide (CO2) and nitrogen oxide (NOx) than other traditional fuels and emits virtually no sulfur dioxide (SO2) and fine particulate matter (PM2.5).
- Increased natural gas has allowed the U.S. to reduce emissions while growing the economy: “Increased use of natural gas — made possible by advances in horizontal drilling and hydraulic fracturing technologies —has allowed the United States to lead all major industrialized countries in carbon reductions this century, while growing its economy significantly, a previously unheard of decoupling trend.”
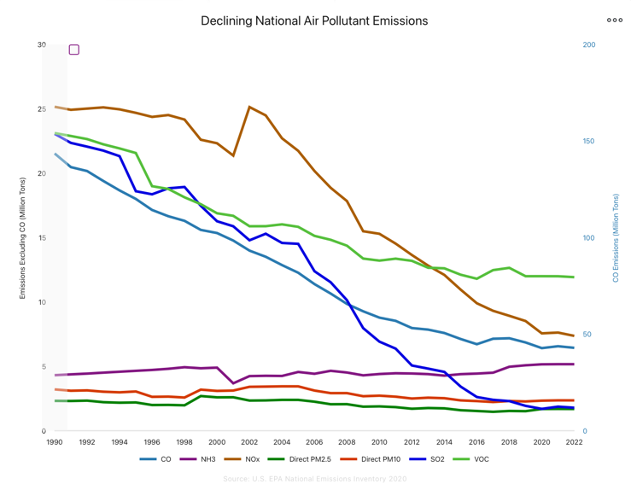
- Since 1990, U.S. emissions have all declined significantly: Since 1990, U.S. emissions of key air pollutants have all declined significantly, including Sulfur Dioxide (SO2) by 88%; Carbon Monoxide (CO) by 67%; and Nitrogen Oxides (NOx) by 59%.
- Significant reductions in methane emissions: From 2018 to 2021, total methane emissions volumes in each of the U.S.’s top oil and natural gas producing basins declined significantly across the board.
Due To The Increased Use Of Natural Gas, The U.S. Leads The World In Reducing CO2 Emissions
- Leading the world: The U.S. is a world leader in lowering carbon emissions, largely because of increased use of natural gas for electricity generation.
- “Thank the underground oceans of America’s natural gas”: Mark Perry of the American Enterprise Institute: “For that impressive ‘greening’ of America, we can thank the underground oceans of America’s natural gas that are now accessible because of the revolutionary, advanced drilling and extraction technologies of hydraulic fracturing and horizontal/directional drilling.”
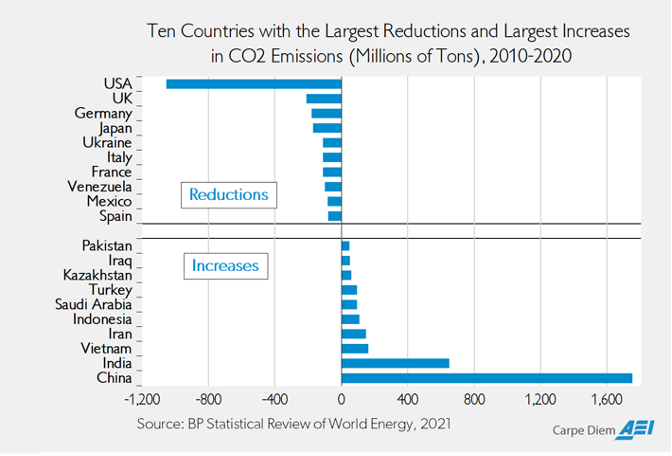
- Most emissions come from China and India: In 2023, China’s fossil fuel emissions went up 458 million metric tons from the previous year—if China and India were excluded from the count, world carbon dioxide emissions would have dropped.
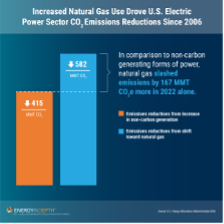
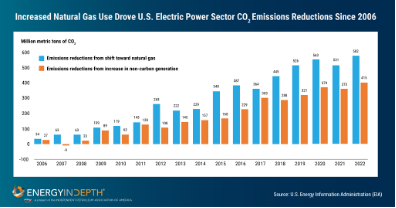
The Reductions In CO2 Emissions From Increased Use Of Natural Gas Are Greater Than Reductions Attributed To Renewables
- S. CO2 savings attributable to increased natural gas greater than renewables: Since 2005, natural gas used for power generation has cut nearly double the emissions that renewable sources like wind and solar have.
U.S. Progress On Cleaner Air Is Offset By Asian Air Pollution That Drifts To The Western U.S.
- Smog levels rise in the Western U.S. due to Asian pollution: A 2017 study found that “The U.S. is producing less air pollution, but smog levels are still rising in the western U.S. because of pollutants released in Asian countries that then drift over the Pacific Ocean.”
- “The major driver” of rising ozone levels: Scientists found Asian air pollution contributed as much as 65 percent of an increase in Western ozone in recent years. The study concluded that the spike in man-made emissions in Asia “is the major driver” of the rise in ozone levels in the western U.S. for both spring and summer in recent decades.
CO2 And Other Key Air Pollutants Have Consistently Declined In The U.S. At The Same Time The Use Of Natural Gas Has Increased And The Economy Has Grown
Since 2005, U.S. emissions have decreased across the board even as natural gas production has increased nearly 100 percent. “Methane emissions from natural gas systems decreased year-over-year, continuing a long-term decline trend which EPA explains is ‘largely due to a decrease in emissions from distribution, transmission and storage, processing, and exploration’: ‘The decrease in distribution is largely due to decreased emissions from pipelines and distribution station leaks, and the decrease in transmission and storage emissions is largely due to reduced compressor station emissions (including emissions from compressors and leaks).’ The EPA adds that the decrease in methane emissions from petroleum systems is ‘due primarily to decreases in emissions from offshore platforms, tanks, and pneumatic controllers.’ The report showed individual system numbers also fell in each category of greenhouse gasses despite record growth.” (Nicole Jacobs, “DRAFT EMISSIONS INVENTORY SHOWS U.S. OIL AND NATURAL GAS METHANE EMISSIONS CONTINUE TO DECLINE, Energy In Depth, 3/2/23)
 (Nicole Jacobs, “DRAFT EMISSIONS INVENTORY SHOWS U.S. OIL AND NATURAL GAS METHANE EMISSIONS CONTINUE TO DECLINE, Energy In Depth, 3/2/23)
“Natural gas emits far less carbon dioxide (CO2) and nitrogen oxide (NOx) than other traditional fuels when burned, and emits virtually no sulfur dioxide (SO2) and fine particulate matter (PM2.5).” “Natural gas emits far less carbon dioxide (CO2) and nitrogen oxide (NOx) than other traditional fuels when burned, and emits virtually no sulfur dioxide (SO2) and fine particulate matter (PM2.5). These facts led the International Energy Agency (IEA) to recently state that, ‘The emissions from natural gas combustion are well-known and show clear advantages for gas relative to other fossil fuels.’” (Seth Whitehead, “As Earth Day Nears, Latest Data Show U.S. Air Quality Continues To Improve, Thanks To Shale Gas, Energy In Depth, 4/19/18)
International Energy Agency (IEA): “The role that natural gas can play in the future of global energy is inextricably linked to its ability to help address environmental problems. With concerns about air quality and climate change looming large, natural gas offers many potential benefits if it displaces more polluting fuels.” (Tim Gould and Christophe McGlade, “The environmental case for natural gas,” International Energy Agency, 10/23/17)
- International Energy Agency (IEA): “This is especially true given limits to how quickly renewable energy options can be scaled up and that cost-effective zero-carbon options can be harder to find in some parts of the energy system.” (Tim Gould and Christophe McGlade, “The environmental case for natural gas,” International Energy Agency, 10/23/17)
International Energy Agency (IEA): “The flexibility that natural gas brings to an energy system can also make it a good fit for the rise of variable renewables such as wind and solar PV.” (Tim Gould and Christophe McGlade, “The environmental case for natural gas,” International Energy Agency, 10/23/17)
“Increased use of natural gas — made possible by advances in horizontal drilling and hydraulic fracturing technologies —has allowed the United States to lead all major industrialized countries in carbon reductions this century, while growing its economy significantly, a previously unheard of decoupling trend.” “As the following EID infographic shows, increased use of natural gas — made possible by advances in horizontal drilling and hydraulic fracturing technologies —has allowed the United States to lead all major industrialized countries in carbon reductions this century, while growing its economy significantly, a previously unheard of decoupling trend.” (Seth Whitehead, “As Earth Day Nears, Latest Data Show U.S. Air Quality Continues To Improve, Thanks To Shale Gas, Energy In Depth, 4/19/18)
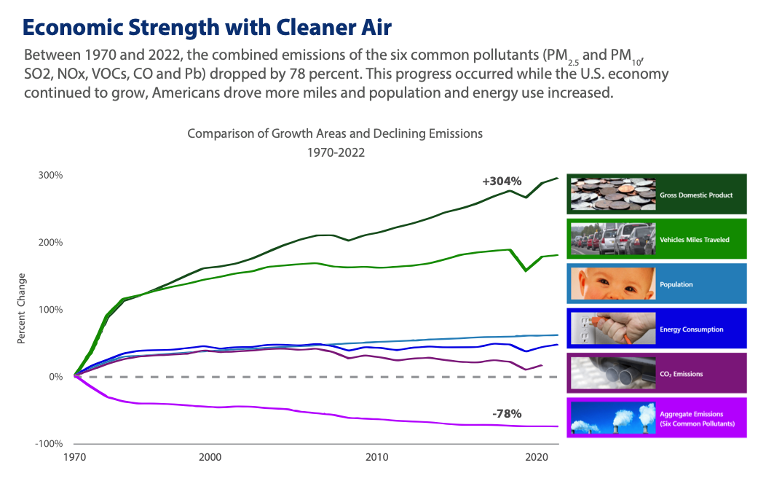
“Between 1970 and 2022, the combined emissions of the six common pollutants (PM2.5 and PM10, SO2, NOx, VOCs, CO and Pb) dropped by 78 percent. This progress occurred while the U.S. economy continued to grow, Americans drove more miles and population and energy use increased.” (“Our Nation’s Air,” Environmental Protection Agency, 2022)
 (“Our Nation’s Air,” Environmental Protection Agency, 2022)
Since 1990, U.S. emissions of key air pollutants have all declined significantly, including Sulfur Dioxide (SO2) by 90%; Carbon Monoxide (CO) by 81%; and Nitrogen Oxides (NOx) by 54%. “Nationally, concentrations of air pollutants have dropped significantly since 1990: Carbon Monoxide (CO) 8-Hour, 81%; Lead (Pb) 3-Month Average, 88% (from 2010); Nitrogen Dioxide (NO2) Annual, 60%; Nitrogen Dioxide (NO2) 1-Hour, 54%; Ozone (O3) 8-Hour, 22%; Particulate Matter 10 microns (PM10) 24-Hour, 34%; Particulate Matter 2.5 microns (PM2.5) Annual, 42% (from 2000); Particulate Matter 2.5 microns (PM2.5) 24-Hour, 42% (from 2000); Sulfur Dioxide (SO2) 1-Hour, 90% Numerous air toxics have declined with percentages varying by pollutant” (“Our Nation’s Air,” Environmental Protection Agency, 2022)
(“Our Nation’s Air,” Environmental Protection Agency, 2022)
International Energy Agency (IEA): “The edge of natural gas over other combustible fuels is reinforced when considering emissions of the main air pollutants, including fine particulate matter (PM2.5), sulfur oxides, mainly sulfur dioxide (SO2), and nitrogen oxides (NOX).” “The emissions from natural gas combustion are well-known and show clear advantages for gas relative to other fossil fuels. CO2 emissions (per unit of energy produced) from gas are around 40% lower than coal and around 20% lower than oil. The edge of natural gas over other combustible fuels is reinforced when considering emissions of the main air pollutants, including fine particulate matter (PM2.5), sulfur oxides, mainly sulfur dioxide (SO2), and nitrogen oxides (NOX).” (Tim Gould and Christophe McGlade, “The environmental case for natural gas,” International Energy Agency, 10/23/17)
- International Energy Agency (IEA): “These three pollutants are responsible for the most widespread impacts of air pollution, according to the WEO Special Report, Energy and Air Pollution 2016.” (Tim Gould and Christophe McGlade, “The environmental case for natural gas,” International Energy Agency, 10/23/17)
University of California-Berkeley Professor of Physics Richard Muller: “The cleanliness shale gas delivers is intrinsic … shale gas results in a 400- fold reduction of PM2.5, a 4,000-fold reduction in sulphur dioxide, a 70-fold reduction in nitrous oxides (NOx), and more than a 30-fold reduction in mercury.” “In the US, substitution of shale gas for coal power was driven in large part by the fact that old coal plants needed to be retrofitted with expensive scrubbers; it was often cheaper to decommission them and build a new combined cycle gas plants instead. The cleanliness shale gas delivers is intrinsic. Compared to coal, shale gas results in a 400- fold reduction of PM2.5, a 4,000-fold reduction in sulphur dioxide, a 70-fold reduction in nitrous oxides (NOx), and more than a 30-fold reduction in mercury. [EIA 1999, EIA 2009]. As a result of this coal-to-gas transition, over the last 15 years, the electric power derived from coal in the US has dropped by 1/3, replaced by shale gas power. This reduction, in turn, is responsible for much of the unanticipated drop in US greenhouse gas emissions during that same period. [Hausfather, 2013].” (“Why Every Serious Environmentalist Should Favour Fracking,” Richard A. Muller And Elizabeth A. Muller, 2013)
From 2018 to 2021, total methane emissions volumes in each of the U.S.’s top oil and natural gas producing basins declined significantly across the board. “Data from the Environmental Protection Agency’s Greenhouse Gas Reporting Program shows that between 2018 and 2022, total methane emissions volumes in each of the country’s top oil and natural gas producing basins declined significantly across the board. The largest decrease in total volume of emissions occurred in the Anadarko Basin, located in Oklahoma, Texas, and Kansas. The Arkoma Basin was responsible for the largest percentage decrease in methane emissions, reducing emissions of the greenhouse gas by an impressive 77 percent during the five-year time period. Notably, operators were able to reduce absolute methane emissions while increasing domestic production to record levels. Following the economic downturn due to COVID-19, companies responded quickly and responsibly to the sudden shifts in supply and demand resulting from Russia’s invasion of Ukraine in early 2022. By the second half of the year, top-producing basins including the Permian were hitting record oil and natural gas production volumes; and importantly, doing so without a corresponding increase in methane emissions.” (Nicole Jacobs, “EPA DATA SHOW ACROSS-THE-BOARD DROPS IN TOTAL METHANE EMISSIONS IN TOP OIL, NATURAL GAS PRODUCING BASINS,” Energy In Depth, 11/29/23)
“Furthermore, recent EPA and Global Carbon Project data show that U.S. oil and natural gas system methane emissions account for just 1.4 percent of overall global methane emissions.” (Seth Whitehead, “As Earth Day Nears, Latest Data Show U.S. Air Quality Continues To Improve, Thanks To Shale Gas, Energy In Depth, 4/19/18)
“A recent Gas Technology Institute’s Center for Methane Research report also finds that U.S. natural gas system methane emissions account for just 0.20 percent of global climate forcing.” (Seth Whitehead, “As Earth Day Nears, Latest Data Show U.S. Air Quality Continues To Improve, Thanks To Shale Gas, Energy In Depth, 4/19/18)
- “Put another way, natural gas emissions from U.S. natural gas development are having a minimal impact on global warming and coming nowhere close to negating natural gas’ climate benefits.” (Seth Whitehead, “As Earth Day Nears, Latest Data Show U.S. Air Quality Continues To Improve, Thanks To Shale Gas, Energy In Depth, 4/19/18)
Due To The Increased Use Of Natural Gas, The U.S. Is A World Leader In Reducing CO2 Emissions
The U.S. is a world leader in lowering carbon emissions, largely because of increased use of natural gas for electricity generation. (Mark Perry, “Some Charts and Commentary Based on BP’s Annual Report on World Energy Statistics,” American Enterprise Institute, 7/9/21; “BP Statistical Review of World Energy,” BP, 2022)
(Mark Perry, “Some Charts and Commentary Based on BP’s Annual Report on World Energy Statistics,” American Enterprise Institute, 7/9/21)
Mark Perry of the American Enterprise Institute: “For that impressive ‘greening’ of America, we can thank the underground oceans of America’s natural gas that are now accessible because of the revolutionary, advanced drilling and extraction technologies of hydraulic fracturing and horizontal/directional drilling.” “MP: For that impressive ‘greening’ of America, we can thank the underground oceans of America’s natural gas that are now accessible because of the revolutionary, advanced drilling and extraction technologies of hydraulic fracturing and horizontal/directional drilling, and are increasingly displacing coal for the nation’s electricity generation.” (Mark Perry, “Chart Of The Day: In 2017, US Had Largest Decline In CO2 Emissions In The World For 9th Time This Century, American Enterprise Institute, 7/12/18)
In 2023, China’s fossil fuel emissions went up 458 million metric tons from the previous year—if China and India were excluded from the count, world carbon dioxide emissions would have dropped. “If China and India were excluded from the count, world carbon dioxide emissions from the burning of fossil fuels and cement manufacturing would have dropped, Friedlingstein said. The world in 2023 increased its annual emissions by 398 million metric tons, but it was in three places: China, India and the skies. China’s fossil fuel emissions went up 458 million metric tons from last year, India’s went up 233 million metric tons and aviation emissions increased 145 million metric tons.” (SETH BORENSTEIN, “World carbon dioxide emissions increase again, driven by China, India and aviation,” Associated Press, 12/4/23)
- “Outside of India and China, the rest of the world’s fossil fuel emissions went down by 419 million metric tons, led by Europe’s 205 million metric ton drop and a decrease of 154 million metric tons in the United States.” (SETH BORENSTEIN, “World carbon dioxide emissions increase again, driven by China, India and aviation,” Associated Press, 12/4/23)
The Reductions In CO2 Emissions From Increased Use Of Natural Gas Are Greater Than Reductions Attributed To Renewables
Since 2005, natural gas used for power generation has cut nearly double the emissions that renewable sources like wind and solar have. (Mandi Risko, “Natural Gas Is, Once Again, Spearheading Emission Reductions Across The U.S. Power Sector,” Energy In Depth, 11/30/23)
(Mandi Risko, “Natural Gas Is, Once Again, Spearheading Emission Reductions Across The U.S. Power Sector,” Energy In Depth, 11/30/23)
Increased use of natural gas for electricity generation is the top reason for U.S. power sector emissions reductions over the past 17 years—almost double the impact compared to renewable power generation. (Mandi Risko, “Natural Gas Is, Once Again, Spearheading Emission Reductions Across The U.S. Power Sector,” Energy In Depth, 11/30/23)
(Mandi Risko, “Natural Gas Is, Once Again, Spearheading Emission Reductions Across The U.S. Power Sector,” Energy In Depth, 11/30/23)
United Nations Energy Programme Chief Erik Solheim: “In all likelihood, the United States will live up to its Paris commitment, not because of the White House, but because of the private sector.” “And despite the Trump administration’s stated intent of withdrawing from the Paris climate agreement, United Nations Energy Programme Chief Erik Solheim recently said: ‘In all likelihood, the United States will live up to its Paris commitment, not because of the White House, but because of the private sector.’” (Seth Whitehead, “As Earth Day Nears, Latest Data Show U.S. Air Quality Continues To Improve, Thanks To Shale Gas, Energy In Depth, 4/19/18)
U.S. Progress On Cleaner Air Is Offset By Asian Air Pollution That Drifts To The Western U.S.
A study found that “The U.S. is producing less air pollution, but smog levels are still rising in the western U.S. because of pollutants released in Asian countries that then drift over the Pacific Ocean.” “The U.S. is producing less air pollution, but smog levels are still rising in the western U.S. because of pollutants released in Asian countries that then drift over the Pacific Ocean. Researchers say their findings show the importance of a global approach to preserving air quality.” (Bill Chappell, “Smog In Western U.S. Starts Out As Pollution In Asia, Researchers Say,” NPR, 3/3/17)
“‘Scientists found Asian air pollution contributed as much as 65 percent of an increase in Western ozone in recent years,’ NPR’s Rob Schmitz reports from Shanghai. ‘China and India, where many consumer products are manufactured, are the worst offenders.’” (Bill Chappell, “Smog In Western U.S. Starts Out As Pollution In Asia, Researchers Say,” NPR, 3/3/17)
- “The problem, scientists say, is that Asian countries’ emissions of nitrogen oxides — which sunlight then breaks down in reactions that produce ozone — have tripled since 1990.” (Bill Chappell, “Smog In Western U.S. Starts Out As Pollution In Asia, Researchers Say,” NPR, 3/3/17)
- “When those harmful gases circulate to North America, they offset gains in U.S. air quality that have come from cutting nitrogen oxide emissions by 50 percent.” (Bill Chappell, “Smog In Western U.S. Starts Out As Pollution In Asia, Researchers Say,” NPR, 3/3/17)
The study concluded that the spike in man-made emissions in Asia “is the major driver” of the rise in ozone levels in the western U.S. for both spring and summer in recent decades. “They concluded that the spike in man-made emissions in Asia “is the major driver” of the rise in ozone levels in the western U.S. for both spring and summer in recent decades. The researchers cited data that ranges from Joshua Tree National Park in Southern California to observations in Denver, Colo., and the eastern U.S. According to the EPA, high levels of ground-level ozone “can be harmful to people, animals, crops, and other materials.” The agency adds, ‘Ozone can aggravate asthma, and can inflame and damage cells that line your lungs.’” (Bill Chappell, “Smog In Western U.S. Starts Out As Pollution In Asia, Researchers Say,” NPR, 3/3/17)
- The study authors concluded that “the increase in Asian anthropogenic emissions is the major driver of rising background O3 over the WUS for both spring and summer in the past decades …” “We conclude that the increase in Asian anthropogenic emissions is the major driver of rising background O3 over the WUS for both spring and summer in the past decades, with a lesser contribution from methane increases over this period. The tripling of Asian NOx emissions since 1990 con- tributes up to 65 % of modeled springtime background O3 increases (0.3–0.5 ppb yr−1 ) over the WUS, outpacing O3 decreases resulting from 50% US NOx emission controls (≤ 0.1 ppb yr−1 ; Table 2 and Fig. 10). Springtime O3 ob- served in the Denver metropolitan area has increased at a rate similar to remote rural sites (Fig. 17b). Mean spring- time O3 above the WUS is projected to increase by ∼ 10 ppb from 2010 to 2030 under the RCP8.5 global change scenario but to remain constant throughout 2010 to 2050 under the RCP4.5 scenario (Fig. 14). As NOx emissions in China con- tinue to decline in response to efforts to improve air quality (Krotkov et al., 2016; Liu et al., 2016), rising global methane and NOx emissions in the tropical countries (e.g., India) in Asia, where O3 production is more efficient, may become more important in the coming decades. A global perspective is necessary when designing a strategy to meet US O3 air quality objectives.” (Meiyun Lin et al, “US Surface Ozone Trends And Extremes From 1980 To 2014: Quantifying The Roles Of Rising Asian Emissions, Domestic Controls, Wildfires, And Climate,” Atmospheric Chemistry and Physics, 3/1/17)